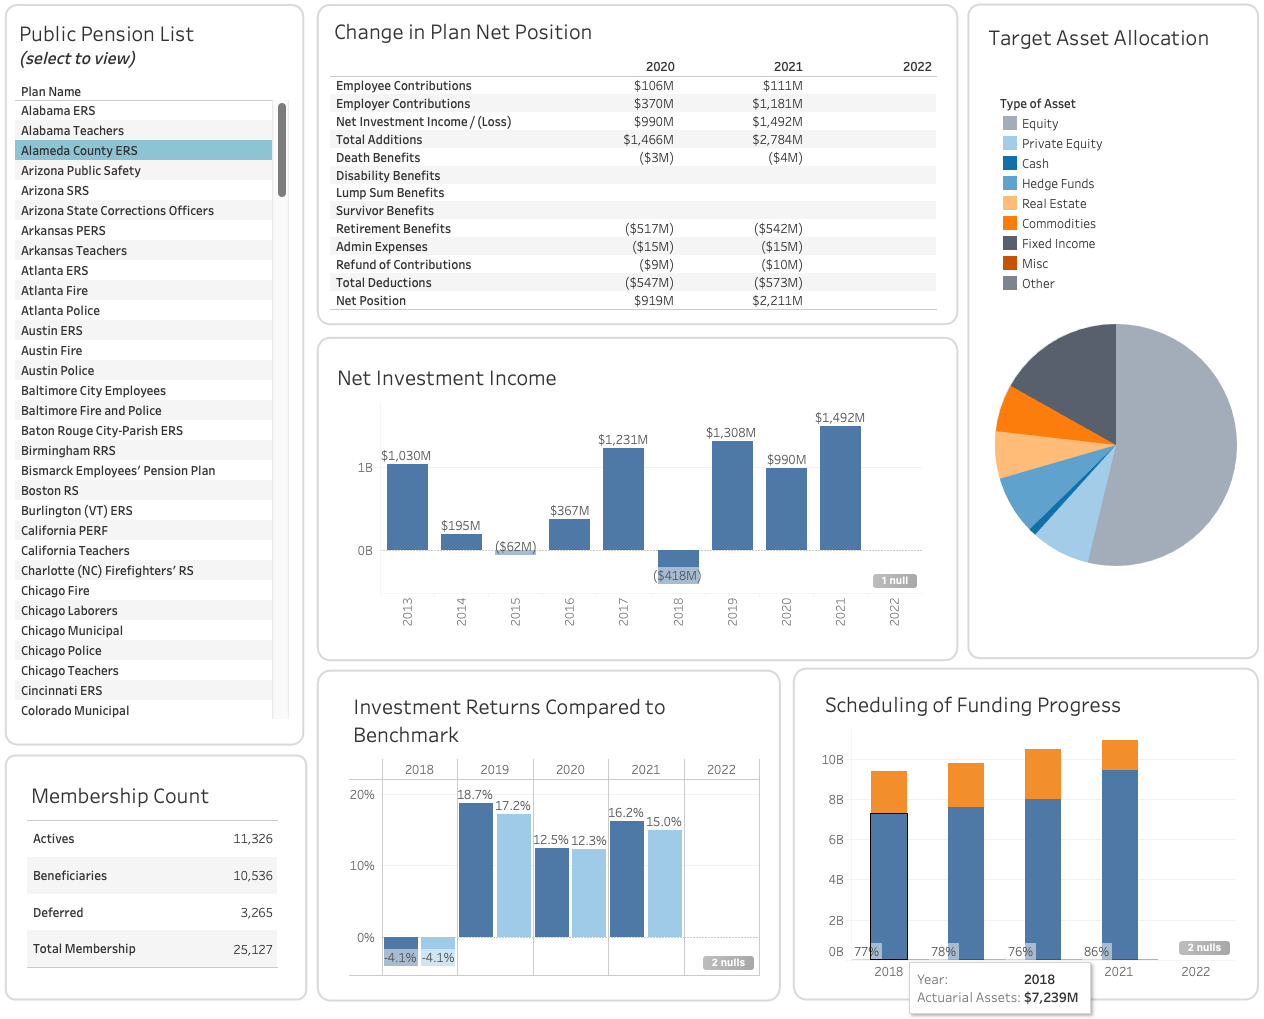
Looking at recent data on public pensions I was surprised at how common unfunded liabilities were and why managers of these funds were at a loss to correct the imbalance. I postulated that all stakeholders in these under funded public pensions share the assumption that investment performance will reduce liabilities and improve funding levels in time. I question the basis of this reasoning and propose a more objective approach to identify potential areas for financial improvement.
Goal
In this project we explore the attributes of public pensions that identify as having high unfunded liabilities and compare it to those with low unfunded liabilities. We will examine financial data to define these differences and collect evidence of any correlations that may explain why unfunded liabilities are so prevalent.
Outcome
The data indicates a pattern of unbalanced cash flow that contributes to higher rates of unfunded liabilities. Even in times of extraordinary investment performance, such as seen in 2021, only those pensions with minimal total deductions relative to cash inflows had the greatest positive impact on net position.
Overview
Role: Data Analyst
Requirements: Develop a public pensions dashboard
Timeline: Approximately 40 hours
Tools: Apache Airflow, Python, SQL, Azure Data Studio, Affinity Design, Tableau
Plan

Extract

Analyze

Visualize

Plan (3 Steps)
- Extract and Load
- Pull public pension data from Public Pensions Database
- Import dataframes into SQL Postgres Database
- Analyze data in SQL
- Feature selection
- Omitt pension plans that have been closed
- Export datasets into Excel files
- Design Tableau dashboard
- Display each section of financial report
Extract, Transform, and Load
- Data source: Public Pensions Database
- All fields were collected: Financials, Asset allocation, etc.
Apache Airflow
- Build three DAG functions to auto extract and load data into Postgresql database
- Set Airflow to run every week to update database
Code Snippet: Apache Airflow (Python)
View CodeAnalyze Data
- Feature selection - Azure Data Studio
Code Snippet: Azure Data Studio Code (SQL)
View CodeEvaluate Results
- Design dashboard elements - Affinity Design
- Build sheets and dashboards - Tabeau
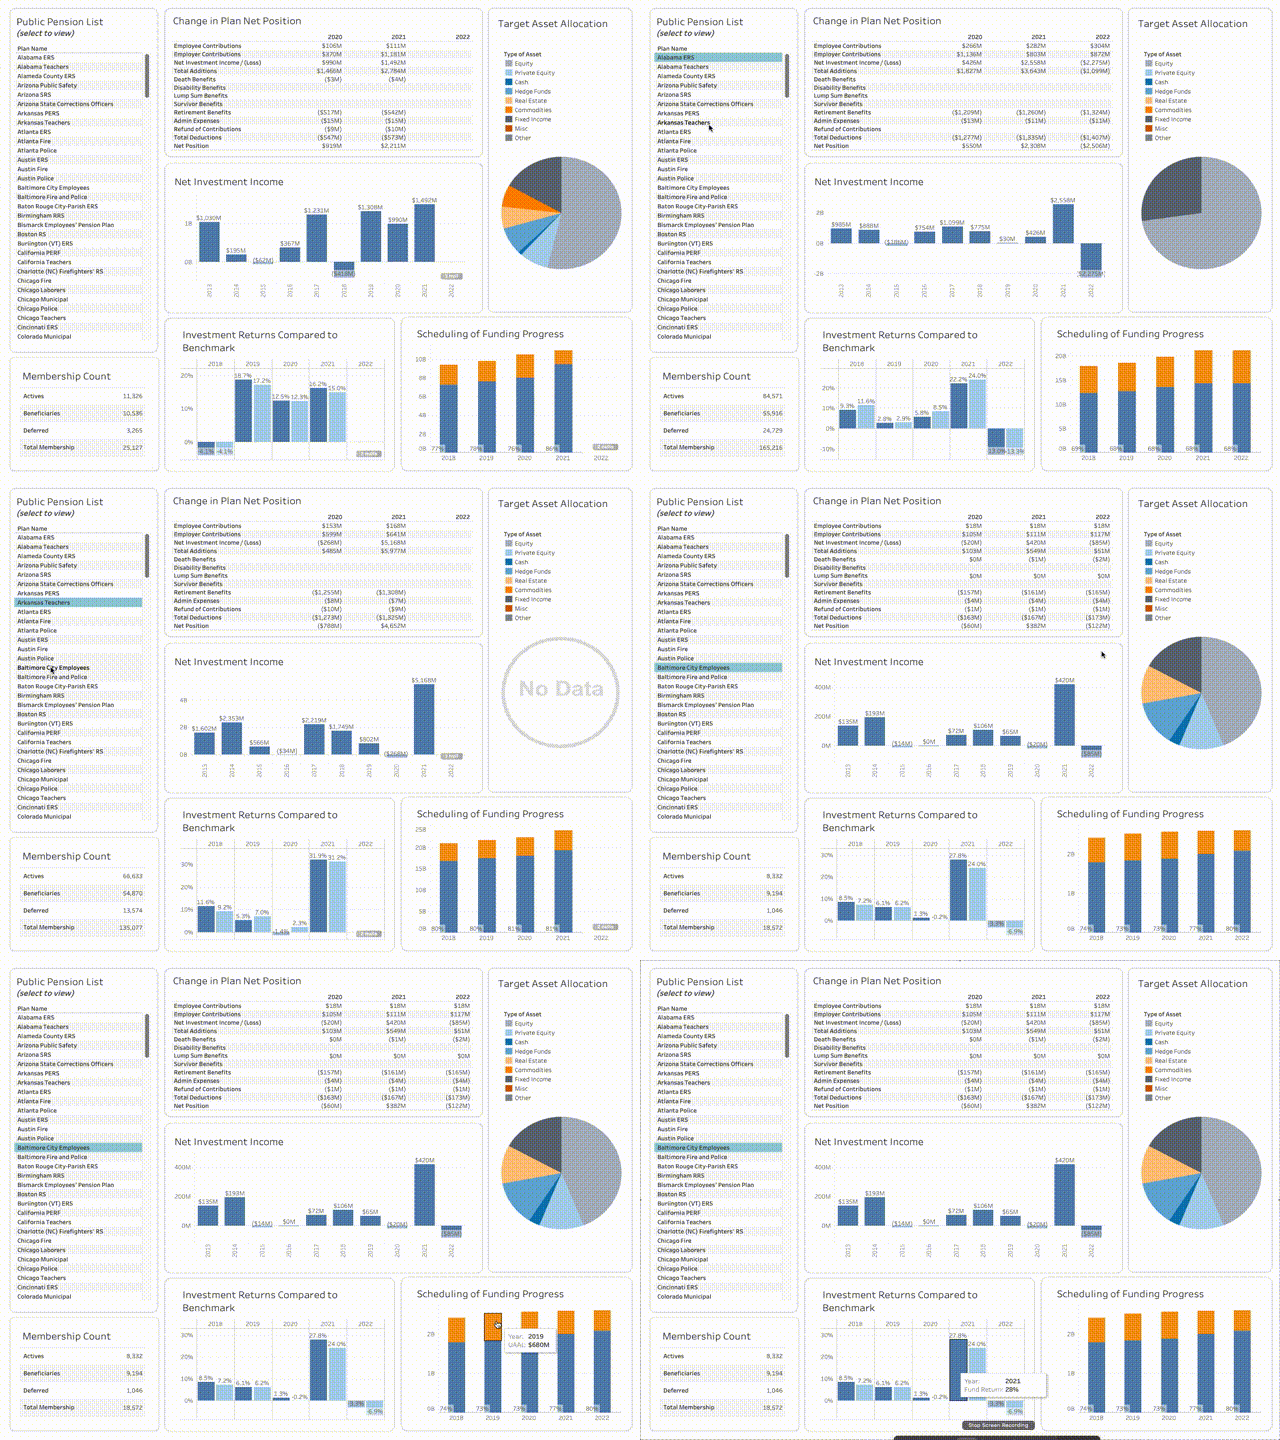
- Details sections with net position, membership, investment performance
- Additional section with asset allocation information
Tableau Dashboard Shapshot 📸

Conclusion
Every year that goes by the value of public pensions is drawn down. As members collect on pension benefits the fund value is diminished. That is why it is essential that the actuarial planning of cash outflows is in balance with expected inflows. But when planning and cashflow balancing is not performed in accordance with what is prudent, the pension is threatened and members are at a loss.
Not only are the members at a loss but so is the state or local government. Using 2021 as the base year, the data shows that pensions less than half funded have the greatest share of employer contributions as a percentage of total deductions at an average of 88%. That is compared to pensions more than 90% funded with employer contributions as a percentage of total deduction of 70%. That's a difference in employer contributions to deductions of 18%, far more financially burdensome to the state or local government. What is more surprising are the impacts of investment gains on annual net positions. Pensions that are below 50% funded have an investment inflow to total deductions rate of 102%, compared to the more lofty figure of 444% for pensions that are above 90% funded. A difference in the impact of investment inflows of 342%. Highly funded pensions are more effective at translating investment gains into actuarial assets because of lower total deductions on average. Once a pension becomes unbalanced in how it manages cashflow, recovery to accrue positive actuarial assets relative to unfunded liabilities becomes more difficult.
In this project we explored public pension fund data in an effort to gain a better understanding of how specific factors contribute to higher levels of unfunded liabilities. The results, high total deductions relative to cash inflows significantly contributed to diminishing impacts of investment gains and increase the burden on state and local government to make up the difference for low asset levels. Investment gains, even in extraordinaty times such as experienced in 2021, are not enough to correct for years of cashflow imbalances. Policy recommendation moving forward is to focus on improving monitoring and evaluation of cashflow balances, and making adjustment as needed.

