When residential property is in financial distress so too is the owner. In these trying times owners have little to guide them out from under this burden and often must wait to be foreclosed on. However this does not have to be the case, and in other instances can be an opportunity. When the going gets tough, the tough get going. Investors may step in before the foreclosure process and rescue the distressed property so that it may retain its value at the market rate.
Goal
The challenge of investing in pre-foreclosure property is the increase in costs associated with identifying investment opportunities. In this project we aim to lower the research costs by improving investment prospects through a data-driven approach.
Outcome
A more streamline research experience for investors looking into the pre-foreclosure market has the benefit of lower barriers to entry and increased market clearing capacity.
Overview
Role: Data Analyst
Requirements: Develop a pre-foreclosure property dashboard
Timeline: Approximately 80 hours
Tools: Python, Jupyter Lab, SQL, Azure Data Studio, Affinity Design, Tableau
Plan

Extract

Analyze

Visualize

Plan (3 Steps)
- Extract, Transform, and Load
- Pull list of distressed properties from King County Records
- Pull property details from related resources
- Pull National Mortgage Database (NMDB) dataset
- Sort and transform data in Pandas
- import dataframes into SQL Postgres Database
- Create subsets in Azure Data Studio
- Using SQL queries to create data tables
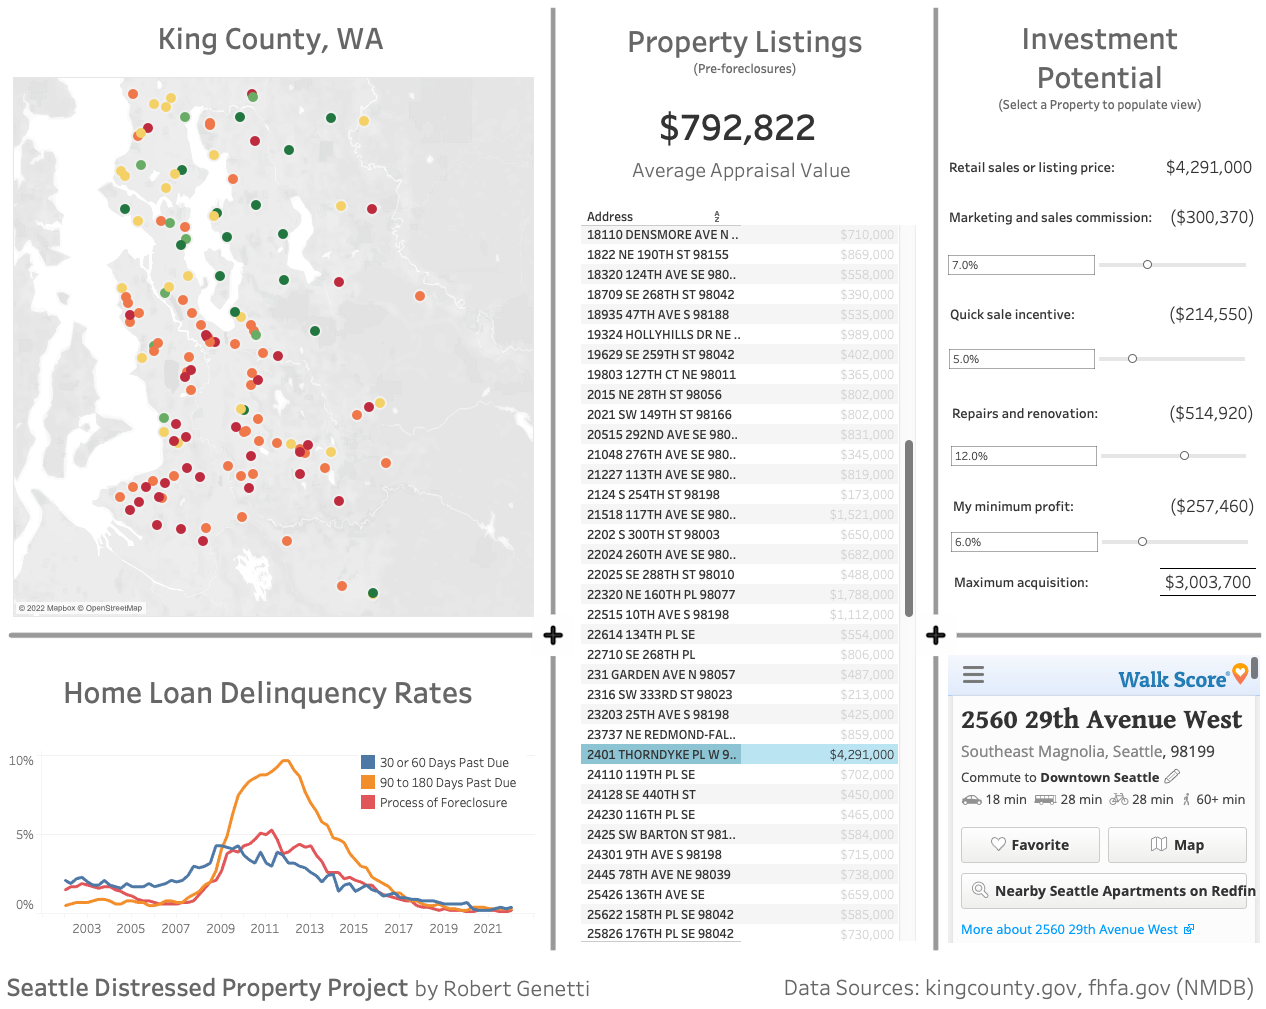
- Design Tableau dashboard
- Map feature to filter by location
- List for selection
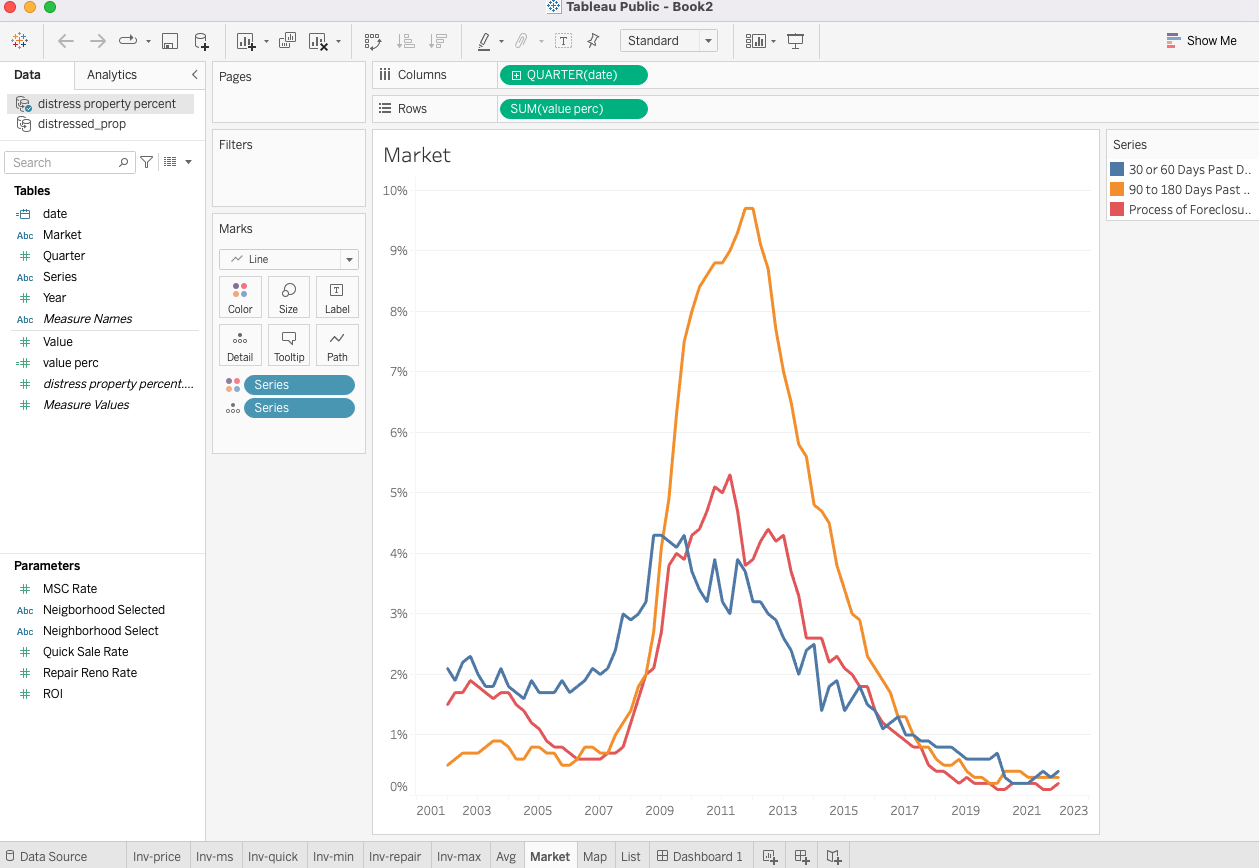
- Past due home loan data line chart
- Display investment potential figures with params
- Walkability Score
Extract, Transform, and Load
- Data sources: King County Records, Parcel Viewer, National Mortgage Database
- All fields were collected: property details, mortgage deliquency rates
Jupyter Notebook
- Build Python functions to extract and load data into Postgresql database
- Transform and join data from two sources
Code Snippet: JupyterLab (Python)
View CodeJupyter Notebook
- Build Python functions to extract and load data into Postgresql database
- Filter data to only include most relevant
Code Snippet: JupyterLab (Python)
View CodeAnalyze Data
- Feature selection - Azure Data Studio
Code Snippet: Azure Data Studio Code (SQL)
View CodeEvaluate Results
- Design dashboard elements - Affinity Design
- Build sheets and dashboards - Tabeau
- Main section with map for geographic context
- Details section with investment costs estimates
- Additional section with market context illustrating national deliquency rates
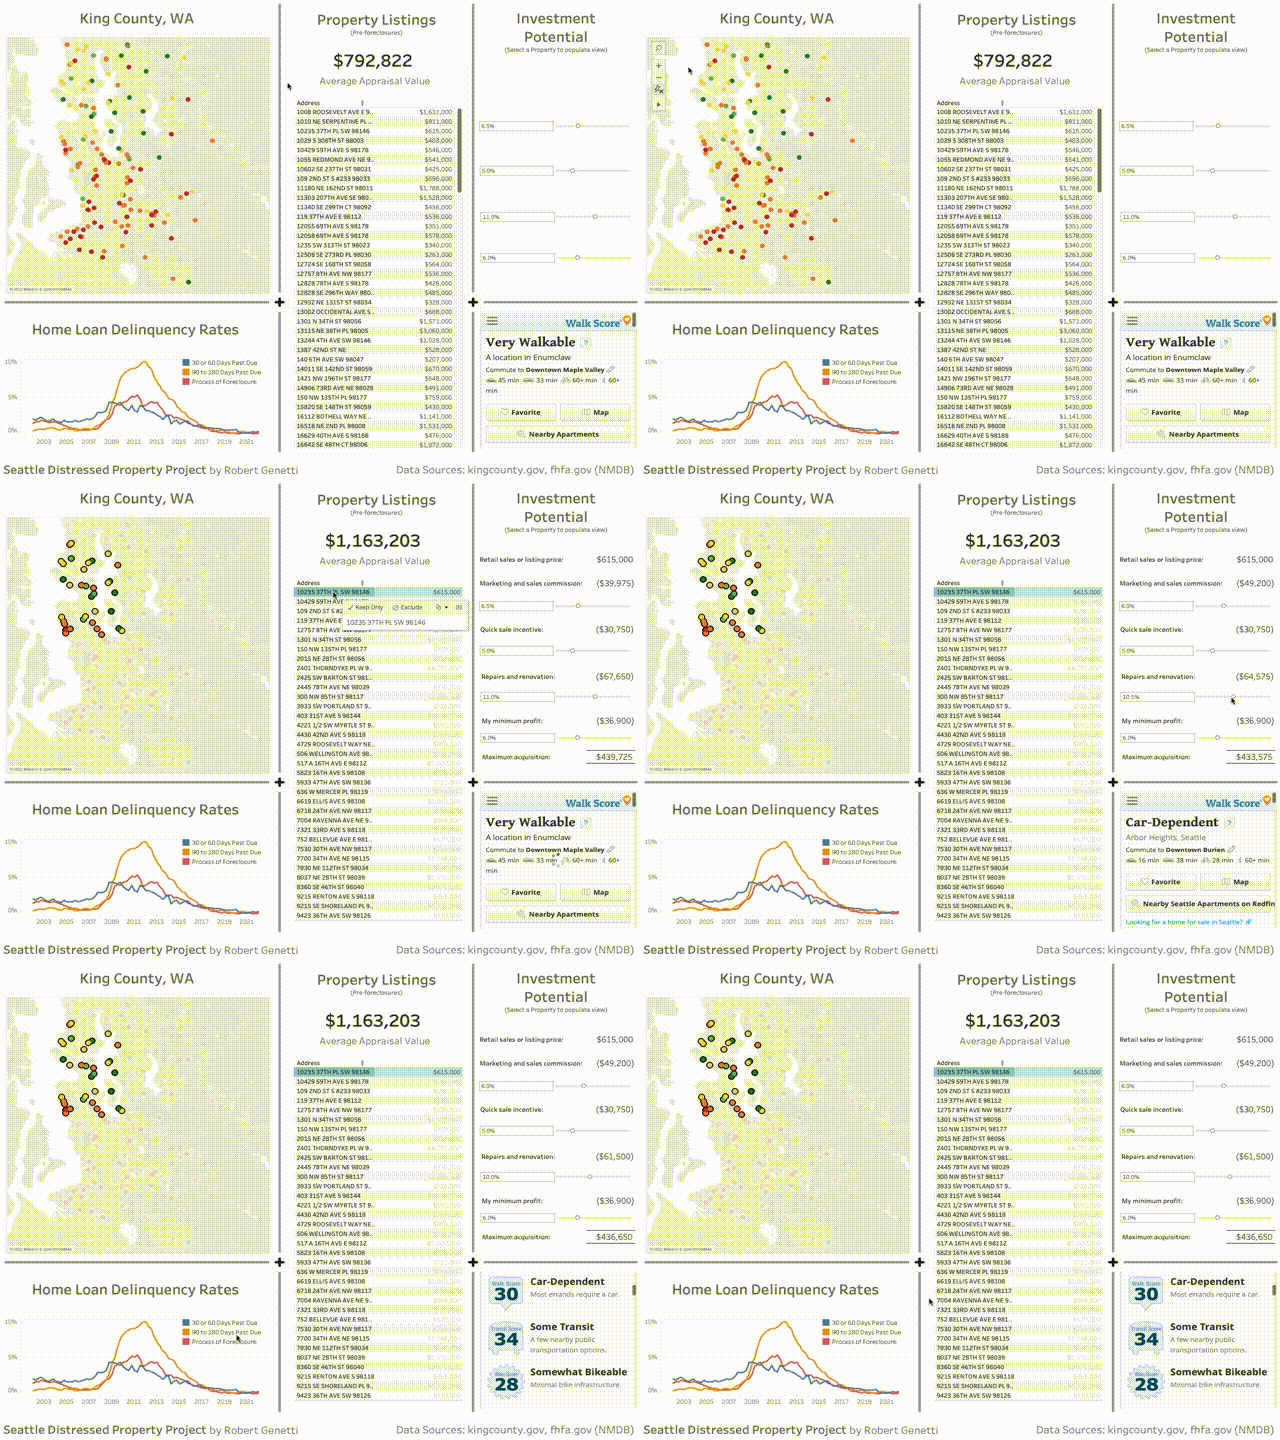
Tableau Dashboard Shapshot 📸

Conclusion
Not long ago the nation experienced a deep and painful recession and in this period of financial uncertainty many residential property under financial strain flooded the market. Market participants were slow to react and as a result prolonged the market clearing process. Pre-foreclosures being a prime example of this, represented an opportunity for unlocking great value.
How this value can be unlocked is not with anyone solution. But with this research tool we have created, I aim to reduce the costs of investment uncertainty and market research if it is only an incremental improvement. The greatest value is to the owners of these properties for which may improve their opportunities to recover and progress in their future.
This project examines potential areas for cost reduction and research efficiency by using a data-driven approach. Included in the research tool capability is a contextual map feature, delinquency rates graph, and investment costs estimation calculator. If interested in this market, and would like to become an investor yourself, pick up a copy of Cashing In On Pre-foreclosures and Short Sales by Chip Cummings.


