Learning to invest is a great skill to have, but can be a bit intimidating for the uninitiated. Having on hand the necessary analytical tools can make all the difference. Being better prepared when financial shift in the market occur and responding in kind is essential. Using a stock screener is one of those necessary tools and will make cross comparison much easier and faster, saving time and money when looking for the next investment opportunity.
Goal
This project aims to improve financial statement learning for beginner investors and provide a basic understanding of common financial ratio analysis.
Outcome
Solid financial analysis skills are the foundation to building more advanced skills and becoming a successful investor.
Overview
Role: Data Analyst
Requirements: Develop a stock screener and analysis dashboard
Timeline: Approximately 120 hours
Tools: Python, R, Jupyter Lab, SQL, Azure Data Studio, Affinity Design, Tableau
Plan

Extract

Analyze

Visualize

Plan (4 Steps)
- Extract, Transform, and Load
- Pull list of companies in S&P 500
- Pull financial data from Yahoo Finance
- Sort and transform data in Pandas
- Import dataframes into SQL Postgres Database
- Analyze buy/sell recommendation data in Python
- Select features best suited
- Transform data to limit outliers
- Import into SQL Postgres Database
- Build Linear Regression with Fixed Effects in R
- Explore data
- Perform linear regression on test data
- Use fixed effects to seperate sector bias
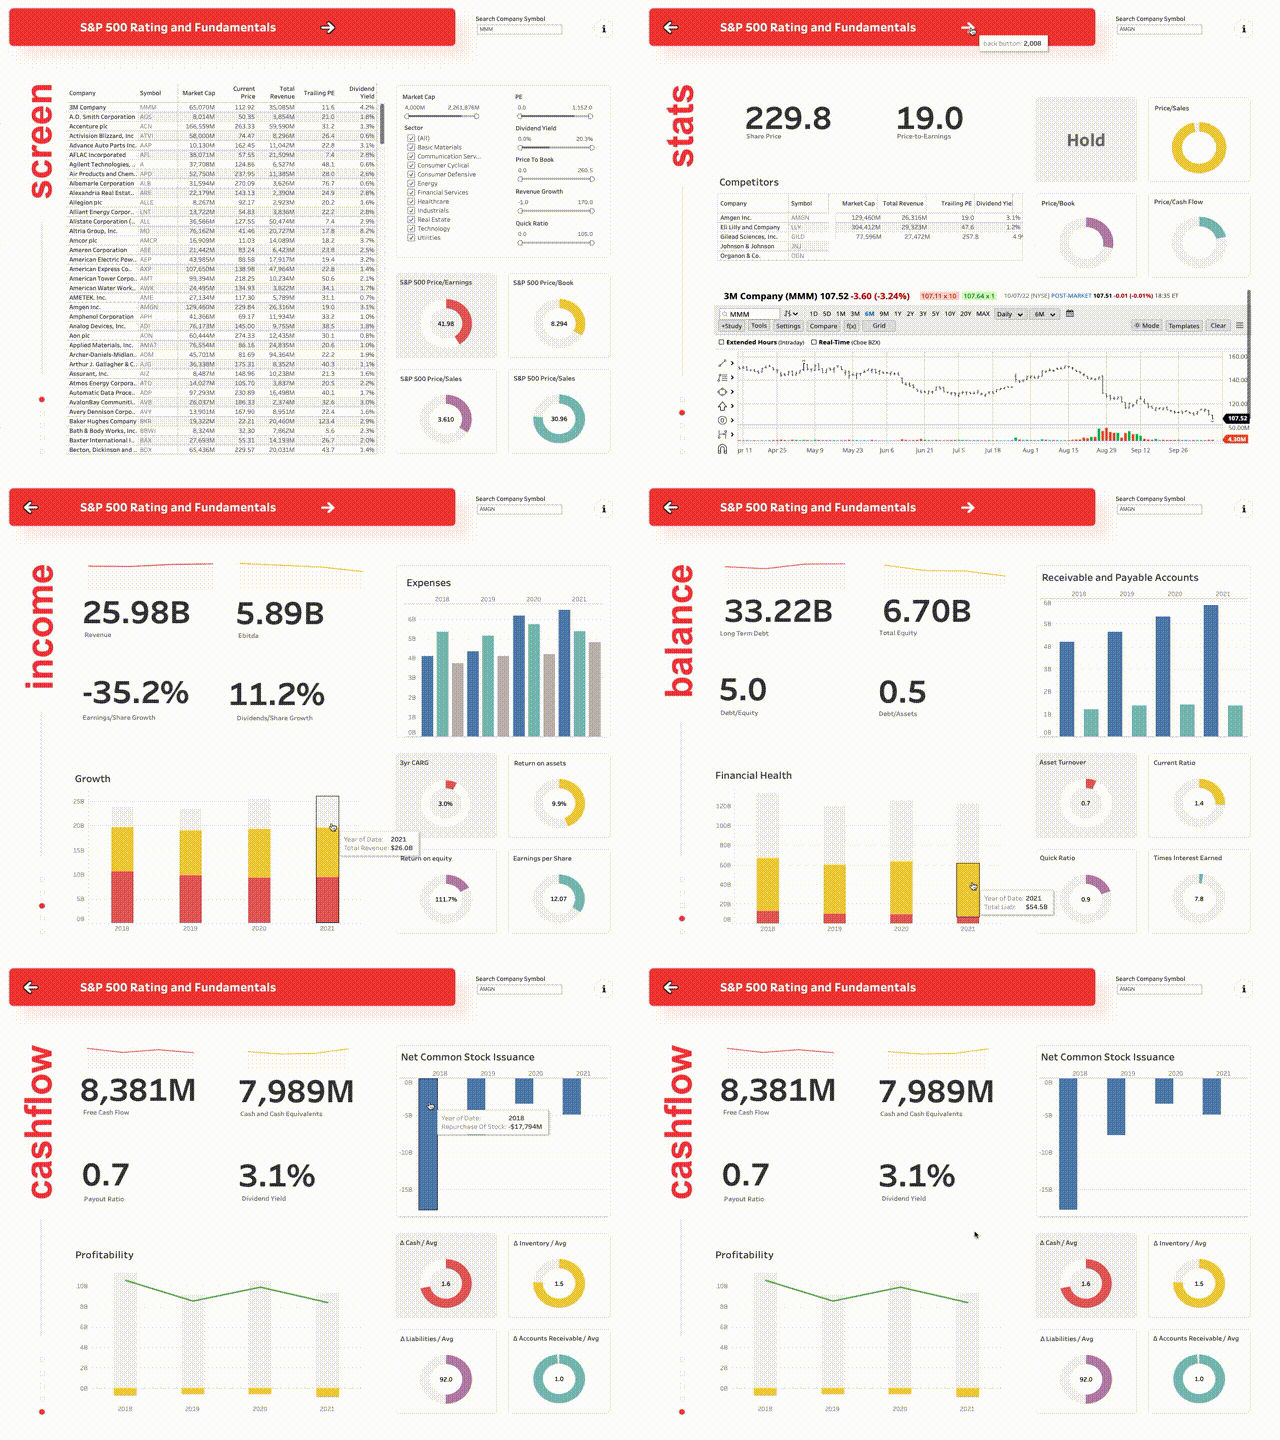
- Design Tableau dashboard
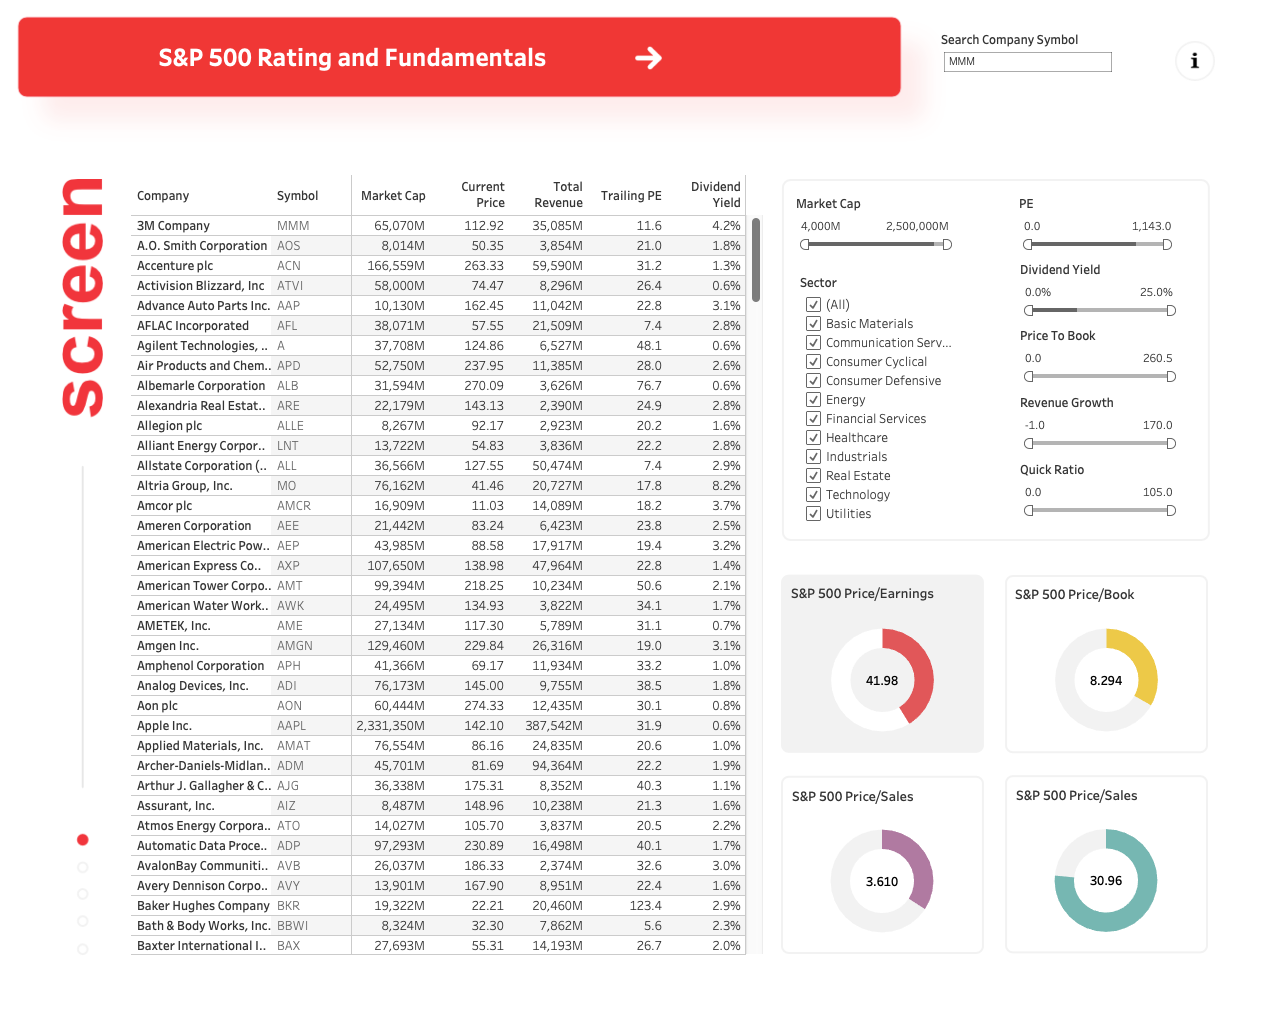
- Screener to filter companies based on specific measures
- Buy/sell recommendation estimate – OLS model
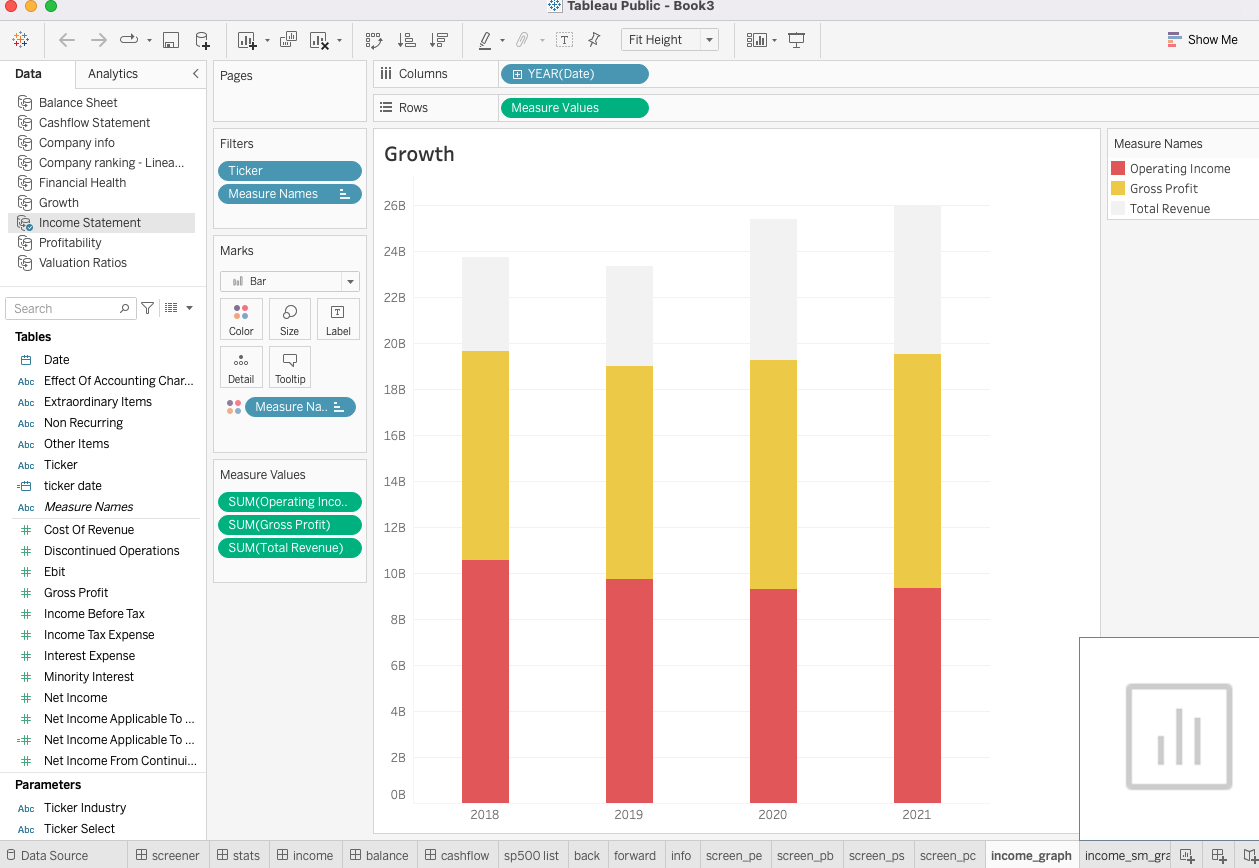
- Income statement KPIs
- Balance sheet KPIs
- Cashflow statement KPIs
Extract, Transform, and Load
- Data source: Yahoo Finance
- Four different datasets were collected: general info, income statement, balance sheet, cashflow statement
- Info dataset common features: symbol, date, total revenue, debt/equity
- Income Statement dataset common features: ticker, date, net income, cost of revenue
- Balance Sheet dataset common features: ticker, date, total assets, total liabilities
- Cashflow Statement dataset common features: ticker, date, cash from operations, cash from financing
Jupyter Notebook
- Build ETL functions to extract and load data into Postgresql database
Code Snippet: JupyterLab (Python)
View CodeAnalyze Data
- Feature selection - Azure Data Studio
- Statistical Analysis - OLS Model to estimate buy/sell recommendations
Code Snippet: Azure Data Studio Code (SQL)
View CodeCode Snippet: JupyterLab (Python)
View CodeCode Snippet: R-Studio (R)
View CodeEvaluate Results
- Design - Affinity Design
- Visualization - Tableau
Tableau Dashboard Shapshot 📸

Conclusion
When I began investing for the first time I had trouble identifying trends and value in the equities market. The novice investors are at risk of making investment decisions based on incomplete information. That is why having a dedicated stock screener and buy/sell recommendations model is important to improving financial analysis skills.
Jan 2023, when this project’s data was last updated, the financial market was in a decidedly downward correction, shifting from the elevated levels of the year and a half before to a slightly lower valuations. Following this trend was lower projected earnings and less favorable buy/sell recommendations. Our own OLS model estimated a majority of stocks as a hold recommendation indicating a pull back in investments is underway.
This project began as simple idea, to build a data visualization that would improve financial statement analysis and recommend buy/sell targets provided with the most recent data. For me the project gave me a better understanding of how different segments of the market are valued and what financial ratios to look for when analyzing specific stocks. If you are interested in financial markets and would like to learn more visit betterinvesting.org for tips on how to become an investor yourself.


